Posted on
October 25, 2019
by
Allan Krueger (Royal LePage Elite West)
I have listed a new property at 25931 DEWDNEY TRUNK RD in Maple Ridge.
15 Acre Estate property with 2 separate homes located close to town offers privacy and revenue! This unique property features City Water, private pond, and a serene stream at the rear of the property. The Main Residence is a 9000 sq ft Bavarian style Log Home with spectacular views - includes: indoor pool, music studio, 6 bedroom, 4 bathrooms, and several expansive areas suitable for both small and large family gatherings. The 2nd house is approx 2400 sq ft, 4 beds, 4 bath, located on Dewdney. Other structures include a Pottery Barn, Detached Garage, and Barn / Workshop. Rental revenue currently $43,200 / year. Large Cleared Field offers space for additional storage Revenue. Move in Ready - brand new Roofs - approx 400k in recent updates. See video for additional info.
Posted on
October 24, 2019
by
Allan Krueger (Royal LePage Elite West)
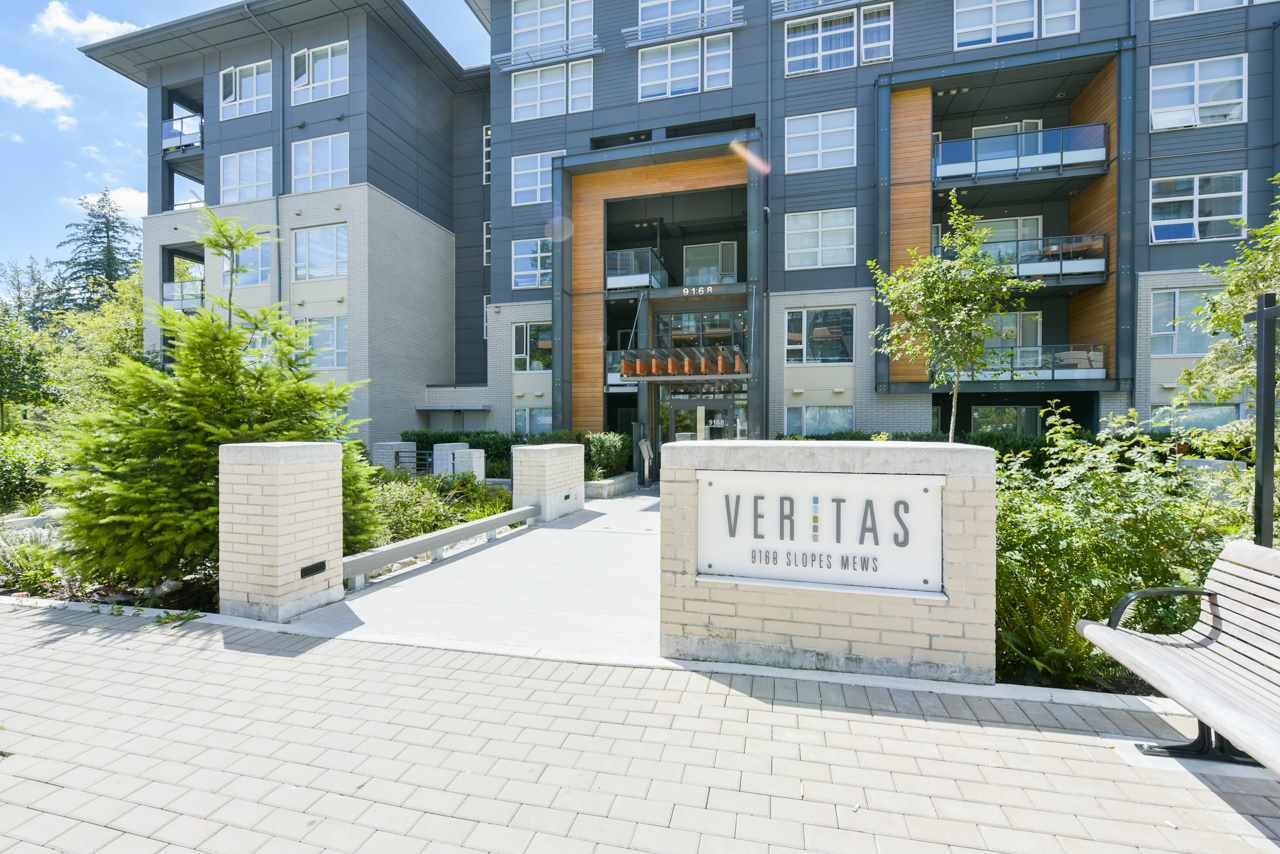
I have sold a property at 502 9168 SLOPES MEWS in Burnaby.
Live above it all on the Top Floor in this corner unit by Polygon Home! Super private with only one shared wall, this 2 bedroom 2 full bathroom condo has been meticulously cared for and it shows! Features include Polished Engineered Stone Counters, Stainless Appliance Package, Glass Tile backsplash, and rich wood laminate flooring. Spacious 968 sq ft of efficient floor space with bedrooms on opposite corners - tons of privacy and perfect for roommates. South East views from the kitchen and oversize Covered Deck! In floor heating throughout! This condo is absolutely move in ready with Full Size Laundry, upgraded high end Hunter Douglas Blinds, Massive Storage Locker and perhaps the best parking stall in the building.
Posted on
October 23, 2019
by
Allan Krueger (Royal LePage Elite West)
I have listed a new property at 6 2115 SPRING ST in Port Moody.
Immaculately cared for 4 bed/4 bath townhouse IN NAME ONLY; it’s fully detached from all neighbors! Enjoy a fully styled home with new laminate flooring and updated carpets, custom paint in every room, modern wallpaper accent walls and upgraded window treatments. Each room is networked to a central hub for work & play. Relax in freshly renovated bathrooms including walk-in spa shower, heated tile flooring, quartz countertops & fog free LED/Bluetooth mirrors still under warranty. Don’t stress over the yard with low maintenance synthetic grass, perennial ferns & hostas and a private patio area at the side. Get to work and back before everyone else with one of the fastest routes in the Tri-Cities to Vancouver and Burquitlam. Park 2 cars inside plus 1 outside! Easy walk to PMSS, Rocky Point Park & Skytrain. Short drive to SFU, Lougheed & Coquitlam Center. A kid friendly “cul-de-sac” community in an upcoming Neighbourhood! Option to purchase some furniture and decor items. Open Sat Oct 26, 1-3, Sunday, Oct 27, 12-3
Posted on
October 8, 2019
by
Allan Krueger (Royal LePage Elite West)
I have listed a new property at 12251 272 ST in Maple Ridge.
Spacious Two Storey plus basement home in private treed creekside location. Room to grow or live with extended family on this near One Acre Parcel featuring extra large rec rooms, fresh updates, and private yard. Two car garage and ample parking for another eight.
Posted on
October 7, 2019
by
The 604 New Home Team
Property sales in Fraser Valley have recovered bringing market into balance
SURREY, BC – For the third straight month, home sales in the Fraser Valley surpassed 2018 levels bringing the market back in line with long-term averages.
The Fraser Valley Real Estate Board processed 1,343 sales of all property types on its Multiple Listing Service® (MLS®) in September, a 3.5 per cent increase compared to sales in August 2019, and a 29.8 per cent increase compared to the 1,035 sales in September of last year.
Darin Germyn, President of the Board, says, “The market’s return to balance is good news for both buyers and sellers, however it’s important to put the 30 per cent year-over-year increase in sales into context. September’s sales went from amongst the worst in 10 years to just above our 10-year average.
“Home prices are still dropping compared to a year ago, but on a month-to-month basis, prices are moderating because supply is shrinking. Our incoming supply of new listings has dropped consistently for the last four months pushing our total inventory in the Fraser Valley to the lowest it’s been since April, which has had an impact on prices.”
There were 7,946 active listings available in the Fraser Valley at the end of September, an increase of 3.9 per cent compared to September of last year and a decrease of 1.2 per cent compared to August 2019. The Board received 2,769 new listings in September, a 17.5 per cent increase compared to August 2019’s intake of 2,357 new listings and a 6 per cent decrease compared to September of last year.
Germyn adds, “Financing is still a challenge for many clients, but fortunately in a balanced market like this, REALTORS® have the time to work with clients and advise them of the best strategies for them, whether they are buying or selling.”
MLS® HPI Benchmark Price Activity
- Single Family Detached: At $950,000, the Benchmark price for a single-family detached home in the Fraser Valley decreased 0.4 per cent compared to August 2019 and decreased 3.9 per cent compared to September 2018.
- Townhomes: At $520,000 the Benchmark price for a townhome in the Fraser Valley in the Fraser Valley decreased 0.3 per cent compared to August 2019 and decreased 4.8 per cent compared to September 2018.
- Apartments: At $405,500, the Benchmark price for apartments/condos in the Fraser Valley decreased 0.9 per cent compared to August 2019 and decreased 7.6 per cent compared to September 2018.
For the Fraser Valley region, the average number of days to sell an apartment in September was 41, and 37 for townhomes. Single family detached homes remained on the market for an average of 46 days before selling.
Find the September Statistics Package here.
Posted on
October 2, 2019
by
Allan Krueger
Increased demand helps housing market reach balanced territory
Home buyer demand has returned to more historically typical levels in Metro Vancouver over the last three months.
The Real Estate Board of Greater Vancouver (REBGV) reports that residential home sales in the region totalled 2,333 in September 2019, a 46.3 per cent increase from the 1,595 sales recorded in September 2018, and a 4.6 per cent increase from the 2,231 homes sold in August 2019.
Last month’s sales were 1.7 per cent below the 10-year September sales average.
“We’re seeing more balanced housing market conditions over the last three months compared to what we saw at this time last year,” Ashley Smith, REBGV president said. “Home buyers are more willing to make offers today, particularly in the townhome and apartment markets.”
There were 4,866 detached, attached and apartment properties newly listed for sale on the Multiple Listing Service® (MLS®) in Metro Vancouver in September 2019. This represents a 7.8 per cent decrease compared to the 5,279 homes listed in September 2018 and a 29.9 per cent increase compared to August 2019 when 3,747 homes were listed.
The total number of homes currently listed for sale on the MLS® system in Metro Vancouver is 13,439, a 2.7 per cent increase compared to September 2018 (13,084) and a 0.3 per cent increase compared to August 2019 (13,396).
For all property types, the sales-to-active listings ratio for September 2019 is 17.4 per cent. By property type, the ratio is 12.7 per cent for detached homes, 18.9 per cent for townhomes, and 21.9 per cent for apartments.
Generally, analysts say that downward pressure on home prices occurs when the ratio dips below 12 per cent for a sustained period, while home prices often experience upward pressure when it surpasses 20 per cent over several months.
“This is a more comfortable market for people on both sides of a real estate transaction,” said Smith. “Home sale and listing activity were both at typical levels for our region in September.”
The MLS® Home Price Index composite benchmark price for all residential homes in Metro Vancouver is currently $990,600. This represents a 7.3 per cent decrease over September 2018 and a 0.3 per cent decrease compared to August 2019.
Sales of detached homes in September 2019 reached 745, a 46.7 per cent increase from the 508 detached sales recorded in September 2018. The benchmark price for a detached home is $1,406,200. This represents an 8.6 per cent decrease from September 2018 and is virtually unchanged compared to August 2019.
Sales of apartment homes reached 1,166 in September 2019, a 43.6 per cent increase compared to the 812 sales in September 2018. The benchmark price of an apartment property is $651,500. This represents a 6.5 per cent decrease from September 2018 and a 0.4 per cent decrease compared to August 2019.
Attached home sales in September 2019 totalled 422, a 53.5 per cent increase compared to the 275 sales in September 2018. The benchmark price of an attached home is $767,500. This represents a 7.2 per cent decrease from September 2018 and a 0.6 per cent decrease compared to August 2019.
Posted on
October 2, 2019
by
Allan Krueger (Royal LePage Elite West)
I have listed a new property at 1020 ALDERSIDE RD in Port Moody.
Opportunity to own on the Golden Mile - True Burrard Inlet Waterfront property! Gorgeous South Facing unobstructed views are yours every day. GREAT LOCATION - Large 4542 sq ft lot surrounded by luxury waterfront homes and close enough to walk to Old Orchard Park and Port Moody Rec Center! Inlet Skytrain Station a pleasant 3.5 km scenic walk along the waterfront Inlet Trail. 1967 Built Tudor style home is in good condition giving you lots of OPTIONS: Live in now, Rent, or Redevelop into your Dream Home!
Posted on
September 24, 2019
by
Allan Krueger (Royal LePage Elite West)
I have sold a property at 409 2335 WHYTE AVE in Port Coquitlam.
Priced to Sell ! Super convenient location - steps to Gates Park, Coquitlam River, walking and biking trails, and all the shops in Downtown Port Coquitlam! Top Floor Massive 1220 sq ft, Two Bath home with great separation between bedrooms and bathrooms. Massive South Facing Deck! Needs Cosmetic work and priced accordingly. Short 10 min walk to West Coast Express and the Brand New Port Coquitlam Recreation Center! Great Opportunity to build up sweat equity in a solid building in a fantastic location!
Posted on
September 17, 2019
by
Allan Krueger (Royal LePage Elite West)
I have listed a new property at 502 9168 SLOPES MEWS in Burnaby.
Live above it all on the Top Floor in this corner unit by Polygon Home! Super private with only one shared wall, this 2 bedroom 2 full bathroom condo has been meticulously cared for and it shows! Features include Polished Engineered Stone Counters, Stainless Appliance Package, Glass Tile backsplash, and rich wood laminate flooring. Spacious 968 sq ft of efficient floor space with bedrooms on opposite corners - tons of privacy and perfect for roommates. South East views from the kitchen and oversize Covered Deck! In floor heating throughout! This condo is absolutely move in ready with Full Size Laundry, upgraded high end Hunter Douglas Blinds, Massive Storage Locker and perhaps the best parking stall in the building.
Posted on
September 4, 2019
by
The 604 New Home Team
Fraser Valley housing market continues to stabilize as sales pick up compared to last year
SURREY, BC – For the second month in a row, home sales in the Fraser Valley surpassed 2018 levels bringing the market closer to historical norms.
The Fraser Valley Real Estate Board processed 1,297 sales of all property types on its Multiple Listing Service® (MLS®) in August, an 11 per cent decrease compared to sales in July 2019, and a 12.3 per cent increase compared to the 1,155 sales in August of last year.
Darin Germyn, President of the Board, observed, “Compared to last year, this August has been quite robust. All property types are selling and we’re seeing a resurgence in the single-family detached market. Across North Delta, Surrey and Langley, sales are up over 25 per cent.
“It’s great to see. We’re returning to a normal, steady market. Our sales, new listings and number of active listings in August were all slightly below the 10-year average.”
There were 8,040 active listings available in the Fraser Valley at the end of August, an increase of 9.6 per cent compared to August of last year and a decrease of 3.6 per cent compared to July 2019. The Board received 2,357 new listings in August, a 15.7 per cent decrease compared to July 2019’s intake of 2,797 new listings and an 8.5 per cent decrease compared to August of last year.
Germyn adds, “Inventory has stopped growing as demand has picked up, which is why we’re also seeing prices moderate. Last month, prices of typical homes in the Fraser Valley were on par with prices from six months ago.”
HPI® Benchmark Price Activity
- Single Family Detached: At $954,100, the Benchmark price for a single-family detached home in the Fraser Valley decreased 0.3 per cent compared to July 2019 and decreased 5.4 per cent compared to August 2018.
- Townhomes: At $521,400, the Benchmark price for a townhome in the Fraser Valley in the Fraser Valley increased 0.1 per cent compared to July 2019 and decreased 4.9 per cent compared to August 2018.
- Apartments: At $409,200, the Benchmark price for apartments/condos in the Fraser Valley decreased 0.1 per cent compared to July 2019 and decreased 7.7 per cent compared to August 2018.
For the Fraser Valley region, the average number of days to sell an apartment in August was 45, and 36 for townhomes. Single family detached homes remained on the market for an average of 44 days before selling.
Posted on
September 4, 2019
by
Allan Krueger
Home buyer activity increased to more typical levels in Metro Vancouver throughout the summer months.
The Real Estate Board of Greater Vancouver (REBGV) reports that residential home sales in the region totalled 2,231 in August 2019, a 15.7 per cent increase from the 1,929 sales recorded in August 2018, and a 12.7 per cent decrease from the 2,557 homes sold in July 2019.
Last month’s sales were 9.2 per cent below the 10-year August sales average.
“Home sales returned to more historically normal levels in July and August compared to what we saw in the first six months of the year,” said REBGV President Ashley Smith.
There were 3,747 detached, attached and apartment properties newly listed for sale on the Multiple Listing Service® (MLS®) in Metro Vancouver in August 2019. This represents a 3.5 per cent decrease compared to the 3,881 homes listed in August 2018 and an 18.8 per cent decrease compared to July 2019 when 4,613 homes were listed.
The total number of homes currently listed for sale on the MLS® system in Metro Vancouver is 13,396, a 13.3 per cent increase compared to August 2018 (11,824) and a 5.9 per cent decrease compared to July 2019 (14,240).
For all property types, the sales-to-active listings ratio for August 2019 is 16.7 per cent. By property type, the ratio is 12 per cent for detached homes, 18.4 per cent for townhomes, and 21.2 per cent for apartments.
Generally, analysts say downward pressure on home prices occurs when the ratio dips below 12 per cent for a sustained period, while home prices often experience upward pressure when it surpasses 20 per cent over several months.
“With more demand from home buyers, the supply of homes listed for sale isn’t accumulating like earlier in the year. These changes are creating more balanced market conditions,” Smith said.
The MLS® Home Price Index composite benchmark price for all residential properties in Metro Vancouver is currently $993,300. This represents an 8.3 per cent decrease over August 2018 and a 0.2 per cent decrease compared to July 2019.
Sales of detached homes in August 2019 reached 706, a 24.5 per cent increase from the 567 detached sales recorded in August 2018. The benchmark price for detached homes is $1,406,700. This represents a 9.8 per cent decrease from August 2018 and a 0.7 per cent decrease compared to July 2019.
Sales of apartment homes reached 1,116 in August 2019, an 8.9 per cent increase compared to the 1,025 sales in August 2018. The benchmark price of an apartment property is $771,000. This represents a 7.4 per cent decrease from August 2018 and a 0.1 per cent increase compared to July 2019.
Attached home sales in August 2019 totalled 409, a 21.4 per cent increase compared to the 337 sales in August 2018. The benchmark price of an attached unit is $654,000. This represents a 7.8 per cent decrease from August 2018, a 0.2 per cent increase compared to July 2019.
For details on activity in your neighbourhood, give us a call!
Posted on
August 24, 2019
by
Allan Krueger (Royal LePage Elite West)
I have listed a new property at 409 2335 WHYTE AVE in Port Coquitlam.
Priced to Sell ! Super convenient location - steps to Gates Park, Coquitlam River, walking and biking trails, and all the shops in Downtown Port Coquitlam! Top Floor Massive 1220 sq ft, Two Bath home with great separation between bedrooms and bathrooms. Massive South Facing Deck! Needs Cosmetic work and priced accordingly. Short 10 min walk to West Coast Express and the Brand New Port Coquitlam Recreation Center! Great Opportunity to build up sweat equity in a solid building in a fantastic location!
Posted on
August 24, 2019
by
Allan Krueger (Royal LePage Elite West)
I have listed a new property at 6 2115 SPRING ST in Port Moody.
Immaculately cared for 4 bed/4 bath fully detached townhouse. Enjoy a custom styled home with new laminate flooring and updated carpets, custom paint in every room, modern wallpaper accent walls and upgraded window treatments. Relax in freshly renovated bathrooms including walk-in spa shower, heated tile flooring, quartz countertops & fog free LED/Bluetooth mirrors. Each room is Cat5 networked to a central hub. Low maintenance yard with synthetic grass, perennial plants and a private patio area. One of the fastest trips in the Tri-Cities to Vancouver and Burquitlam. 3 parking spots. Easy walk to Port Moody High School, Rocky Point Park & Skytrain. Short drive to SFU, Lougheed & Coquitlam Center. A kid friendly “cul-de-sac” community in an upcoming Neighbourhood!
Posted on
August 23, 2019
by
Allan Krueger (Royal LePage Elite West)
I have sold a property at 314 46289 YALE RD in Chilliwack.
Perfect for Investors or first time buyers. Views of the mountains from this downtown Chilliwack, spacious 1 bedroom apartment with in-suite laundry, freshly painted, stainless steel appliances, separate storage locker, underground parking spot, and best of all no restrictions. Centrally located, within walking distance to shopping, restaurants, recreation, school, park, and transit. Must see! Rents have gone up considerably in the area so now it's time to get into the rental market. Tenant pays $975 p/m plus utilities. Secured underground parking.
Posted on
August 23, 2019
by
Allan Krueger (Royal LePage Elite West)
I have listed a new property at 6 2115 SPRING ST in Port Moody.
Immaculately cared for 4 bed/4 bath fully detached townhouse. Enjoy a custom styled home with new laminate flooring and updated carpets, custom paint in every room, modern wallpaper accent walls and upgraded window treatments. Relax in freshly renovated bathrooms including walk-in spa shower, heated tile flooring, quartz countertops & fog free LED/Bluetooth mirrors. Each room is Cat5 networked to a central hub. Low maintenance yard with synthetic grass, perennial plants and a private patio area. One of the fastest trips in the Tri-Cities to Vancouver and Burquitlam. 3 parking spots. Easy walk to Port Moody High School, Rocky Point Park & Skytrain. Short drive to SFU, Lougheed & Coquitlam Center. A kid friendly “cul-de-sac” community in an upcoming Neighbourhood!
Posted on
August 6, 2019
by
The 604 New Home Team
SURREY, BC – A noticeable lift in home sales and slight decrease in new listings bolstered the Fraser Valley housing market in July.
The Fraser Valley Real Estate Board processed 1,458 sales of all property types on its Multiple Listing Service® (MLS®) in July, a 11.6 per cent increase compared to sales in June 2019, and a 13 per cent increase compared to the 1,290 sales in July of last year.
Chris Shields, President-Elect of the Board, observed, “We’ve been expecting market improvement, but didn’t quite anticipate July’s momentum. We’ve gone from the worst June in almost 20 years to a July that’s only slightly below the 10-year average. For both buyers and sellers, a return to an active, more balanced market is welcome news.”
“We attribute the change in July to pent-up demand and an increase in consumer confidence. REALTORS® in our market saw more activity at open houses and an increase in the number of first-time buyers. Data from our informal member market poll in July showed the highest level of first-time buyer purchases in the Fraser Valley since early 2016.”
There were 8,340 active listings available in the Fraser Valley at the end of July, an increase of 12.7 per cent compared to July of last year and a decrease of 2.1 per cent compared to June 2019. The Board received 2,797 new listings in July, a 0.5 per cent decrease compared to June 2019’s intake of 2,810 new listings and a 4.2 per cent decrease compared to July of last year.
“Sales of single family detached in our region increased by over 18 per cent in July compared to last year,” added Shields. “Sellers are now recognizing that although listing prices are down, it’s also now more affordable to buy.”
HPI® Benchmark Price Activity
- Single Family Detached: At $957,400, the Benchmark price for a single-family detached home in the Fraser Valley decreased 0.3 per cent compared to June 2019 and decreased 6.3 per cent compared to July 2018.
- Townhomes: At $520,700, the Benchmark price for a townhome in the Fraser Valley in the Fraser Valley decreased 0.9 per cent compared to June 2019 and decreased 6.6 per cent compared to July 2018.
- Apartments: At $409,700, the Benchmark price for apartments/condos in the Fraser Valley remained unchanged compared to June 2019 and decreased 9 per cent compared to July 2018.
For the Fraser Valley region, the average number of days to sell an apartment in July was 37.9, and 31.7 for townhomes. Single family detached homes remained on the market for an average of 38.6 days before selling.
Posted on
August 3, 2019
by
Allan Krueger (Royal LePage Elite West)
I have listed a new property at 8141 FOREST GROVE DR in Burnaby.
Absolutely gorgeous End Unit Executive Townhouse situated in convenient Forest Hills! 1. DREAM KITCHEN - high end materials, newer stainless steel appliances, glass tile backsplash, accent white upper cabinetry, recessed lighting, ample storage drawers, and finished to a very high standard. 2. AMPLE SPACE - 3 Bedrooms, Huge Den (or Guest room), 3.5 Bathrooms, 2 Parking. 3. LOCATION - Super Convenient access to Highway 1, Lougheed Highway, Lougheed Mall, SFU, Skytrain, yet tucked away in a quiet mountainside forest location! 4. MOVE IN READY - well cared for and upgraded by long time owners! OPEN House Saturday Aug 3, 2-4 pm; Sunday Aug 4, 12 - 2.
Posted on
August 2, 2019
by
Allan Krueger
Home buyer demand picked up across Metro Vancouver last month, making July, a traditionally quieter month in real estate, the second highest selling month so far this year.
The Real Estate Board of Greater Vancouver (REBGV) reports that residential home sales in the region totalled 2,557 in July 2019, a 23.5 per cent increase from the 2,070 sales recorded in July 2018, and a 23.1 per cent increase from the 2,077 homes sold in June 2019.
Last month’s sales were 7.8 per cent below the 10-year July sales average.
“While home sale activity remains below long-term averages, we saw an increase in sales in July compared to the less active spring we experienced,” Ashley Smith, REBGV president said. “Those looking to buy today continue to benefit from low interest rates, increased selection, and reduced prices compared to the heated market a few years ago.”
There were 4,613 detached, attached and apartment properties newly listed for sale on the Multiple Listing Service® (MLS®) in Metro Vancouver in July 2019. This represents a 3.3 per cent decrease compared to the 4,770 homes listed in July 2018 and a 2.9 per cent decrease compared to June 2019 when 4,751 homes were listed.
The total number of homes currently listed for sale on the MLS® system in Metro Vancouver is 14,240, a 17.3 per cent increase compared to July 2018 (12,137) and a 4.9 per cent decrease compared to June 2019 (14,968).
For all property types, the sales-to-active listings ratio for July 2019 is 18 per cent. By property type, the ratio is 13.5 per cent for detached homes, 20 per cent for townhomes, and 22 per cent for apartments.
Generally, analysts say downward pressure on home prices occurs when the ratio dips below 12 per cent for a sustained period, while home prices often experience upward pressure when it surpasses 20 per cent over several months.
“To better understand conditions in your property type or neighbourhood of choice, it’s important to work with your local REALTOR®. They can help you develop a strategy to reach your long-term real estate goals,“ Smith said.
The MLS® Home Price Index composite benchmark price for all residential properties in Metro Vancouver is currently $995,200. This represents a 9.4 per cent decrease over July 2018 and a 0.3 per cent decrease compared to June 2019.
Sales of detached homes in July 2019 reached 841, a 32 per cent increase from the 637 detached sales recorded in July 2018. The benchmark price for detached properties is $1,417,000. This represents a 10.5 per cent decrease from July 2018, and a 0.5 per cent decrease compared to June 2019.
Sales of apartment homes reached 1,243 in July 2019, a 15.2 per cent increase compared to the 1,079 sales in July 2018. The benchmark price of an apartment property is $653,200. This represents an 8.8 per cent decrease from July 2018, and a 0.2 per cent decrease compared to June 2019.
Attached home sales in July 2019 totalled 473, a 33.6 per cent increase compared to the 354 sales in July 2018. The benchmark price of an attached unit is $770,000. This represents a nine per cent decrease from July 2018, and a 0.6 per cent decrease compared to June 2019.
For details on activity in your neighbourhood, give the 604 New Home Team a call.
Posted on
August 2, 2019
by
Allan Krueger (Royal LePage Elite West)
I have listed a new property at 314 46289 YALE RD in Chilliwack.
Posted on
July 4, 2019
by
The 604 New Home Team
Last month’s property sales in the Fraser Valley were 29.3 per cent below the 10‐year sales average for June and were the second lowest total for the month since the year 2000.
The number of new listings also decreased in June, coming in at 9.6 per cent below the 10‐year average for the number of listings received during that month.
The Fraser Valley Real Estate Board processed 1,306 sales of all property types on its Multiple Listing Service® (MLS®) in June, a 13.9 per cent decrease compared to sales in May 2019, and a 10.1 per cent decrease compared to the 1,452 sales in June of last year.
Darin Germyn, President of the Board, commented, “The Fraser Valley market is still adjusting to the federal government’s new mortgage requirements and to the provincial government’s speculation and vacancy taxes. We’re seeing historically low levels for home purchases in our region, and at the same time, we’re seeing some prospective sellers holding back on listing their homes; waiting to see what the market will do. “This has created a great opportunity for buyers in the Fraser Valley. Inventory overall is growing; prices of benchmark, or typical homes, have decreased 6 to 10 per cent over the past year and interest rates are still holding firm.”
There were 8,516 active listings available in the Fraser Valley at the end of June, an increase of 19.3 per cent compared to June of last year and an increase of 0.1 per cent compared to May 2019. The Board received 2,810 new listings in June, a 20.7 per cent decrease compared to May 2019’s intake of 3,542 new listings and a 10.5 per cent decrease compared to June of last year.
“There is tremendous variation in the market depending on the property type and location”, added Germyn. “It’s currently a buyers’ market for detached homes in South Surrey/White Rock; but is leaning towards a sellers’ market for townhomes in Langley, so if you’re considering taking advantage of the market slowdown, first, talk to your REALTOR®.”
HPI® Benchmark Price Activity Single Family Detached: At $960,100, the Benchmark price for a single family detached home in the Fraser Valley decreased 0.4 per cent compared to May 2019 and decreased 6.1 per cent compared to June 2018.
Townhomes: At $525,200, the Benchmark price for a townhome in the Fraser Valley in the Fraser Valley increased 0.5 per cent compared to May 2019 and decreased 5.9 per cent compared to June 2018.
Apartments: At $409,800, the Benchmark price for apartments/condos in the Fraser Valley decreased 1.7 per cent compared to May 2019 and decreased 9.6 per cent compared to June 2018.
For the Fraser Valley region, the average number of days to sell an apartment in June was 37.5, and 31.6 for townhomes. Single family detached homes remained on the market for an average of 35.6 days before selling.
Categories:
604 new home
|
Abbotsford East, Abbotsford Real Estate
|
Albion, Maple Ridge Real Estate
|
Anmore, Port Moody Real Estate
|
Birchland Manor, Port Coquitlam Real Estate
|
Bolivar Heights, North Surrey Real Estate
|
Braemar, North Vancouver Real Estate
|
Brentwood Park, Burnaby North Real Estate
|
Brighouse South, Richmond Real Estate
|
Burke Mountain, Coquitlam Real Estate
|
Canyon Springs, Coquitlam Real Estate
|
Capitol Hill BN, Burnaby North Real Estate
|
Central Abbotsford, Abbotsford Real Estate
|
Central BN, Burnaby North Real Estate
|
Central Coquitlam, Coquitlam Real Estate
|
Central Lonsdale, North Vancouver Real Estate
|
Central Meadows, Pitt Meadows Real Estate
|
Central Pt Coquitlam, Port Coquitlam Real Estate
|
Chilliwack E Young-Yale, Chilliwack Real Estate
|
Chineside, Coquitlam
|
Chineside, Coquitlam Real Estate
|
Citadel PQ, Port Coquitlam Real Estate
|
Cloverdale BC, Cloverdale Real Estate
|
College Park PM, Port Moody
|
College Park PM, Port Moody Real Estate
|
Coquitlam East, Coquitlam Real Estate
|
Coquitlam Real Estate
|
Coquitlam West, Coquitlam Real Estate
|
Cottonwood MR, Maple Ridge Real Estate
|
Crescent Bch Ocean Pk., South Surrey White Rock Real Estate
|
Downtown NW, New Westminster Real Estate
|
Eagle Ridge CQ, Coquitlam Real Estate
|
East Central, Maple Ridge Real Estate
|
Edmonds BE, Burnaby East Real Estate
|
Fairview VW, Vancouver West Real Estate
|
for sale
|
Forest Hills BN, Burnaby North Real Estate
|
Fraserview NW, New Westminster Real Estate
|
Garrison Crossing, Sardis Real Estate
|
GlenBrooke North, New Westminster Real Estate
|
Glenwood PQ, Port Coquitlam Real Estate
|
Government Road, Burnaby North Real Estate
|
Guildford, North Surrey Real Estate
|
Hastings East, Vancouver East Real Estate
|
Hastings, Vancouver East Real Estate
|
Heritage Mountain, Port Moody Real Estate
|
Heritage Woods PM, Port Moody Real Estate
|
Highgate, Burnaby South Real Estate
|
Hockaday, Coquitlam Real Estate
|
house price trends
|
King George Corridor, South Surrey White Rock Real Estate
|
Lake Errock, Mission Real Estate
|
Langley City, Langley Real Estate
|
Lincoln Park PQ, Port Coquitlam Real Estate
|
Lower Mary Hill, Port Coquitlam Real Estate
|
Maillardville, Coquitlam Real Estate
|
market
|
McLennan North, Richmond Real Estate
|
Meadow Brook, Coquitlam Real Estate
|
Metrotown, Burnaby South Real Estate
|
Mid Meadows, Pitt Meadows Real Estate
|
Mission BC, Mission Real Estate
|
Morgan Creek, South Surrey White Rock Real Estate
|
North Coquitlam, Coquitlam Real Estate
|
North Meadows, Pitt Meadows Real Estate
|
North Shore Pt Moody, Port Moody Real Estate
|
Northeast, Maple Ridge Real Estate
|
Northlands, North Vancouver Real Estate
|
Oxford Heights, Port Coquitlam Real Estate
|
Point Grey, Vancouver West Real Estate
|
Port Moody
|
Port Moody Centre, Port Moody Real Estate
|
Port Moody Real Estate
|
Queensborough, New Westminster Real Estate
|
Ranch Park, Coquitlam Real Estate
|
Real Estate Assessment
|
Renfrew VE, Vancouver East Real Estate
|
Riverwood, Port Coquitlam Real Estate
|
S.W. Marine, Vancouver West Real Estate
|
Silver Valley, Maple Ridge Real Estate
|
Simon Fraser Hills, Burnaby North Real Estate
|
Simon Fraser Univer., Burnaby North Real Estate
|
South Meadows, Pitt Meadows Real Estate
|
Sullivan Heights, Burnaby North Real Estate
|
Sullivan Station, Surrey Real Estate
|
Thornhill, Maple Ridge Real Estate
|
Uptown NW, New Westminster Real Estate
|
Vancouver
|
Walnut Grove, Langley Real Estate
|
Websters Corners, Maple Ridge Real Estate
|
West Central, Maple Ridge Real Estate
|
Westwood Plateau, Coquitlam Real Estate
|
White Rock, South Surrey White Rock Real Estate
|
Willoughby Heights, Langley Real Estate
|
Woodland Acres PQ, Port Coquitlam Real Estate
Posted on
July 8, 2025
by
Allan Krueger (Royal LePage Elite West)
Please visit our Open House at 4 3347 Dewdney Trunk Road in Port Moody. See details here
Open House on Saturday, July 12, 2025 2:00PM - 4:00PM
This rarely available, spacious 4 bed, 3 bath end unit is at...
Posted on
July 8, 2025
by
Allan Krueger (Royal LePage Elite West)
Please visit our Open House at 4 3347 Dewdney Trunk Road in Port Moody. See details here
Open House on Sunday, July 13, 2025 2:00PM - 4:00PM
This rarely available, spacious 4 bed, 3 bath end unit is at...
Posted on
July 8, 2025
by
Allan Krueger (Royal LePage Elite West)
I have listed a new property at 4 3347 Dewdney Trunk Road in Port Moody. See details here
This rarely available, spacious 4 bed, 3 bath end unit is at the back of quiet 7 unit complex and only a 5 minute...
Posted on
July 5, 2025
by
Allan Krueger (Royal LePage Elite West)
Please visit our Open House at 3141 Jervis Street in Port Coquitlam. See details here
Open House on Saturday, July 5, 2025 12:30PM - 2:00PM
Opportunity Knocks! Flat Rectangular 6615 Sq Ft Lot with Lane...
Posted on
July 5, 2025
by
Allan Krueger (Royal LePage Elite West)
Please visit our Open House at 310 2429 Hawthorne Avenue in Port Coquitlam. See details here
Open House on Saturday, July 5, 2025 1:00PM - 3:00PM
Top-floor 1 bed, 1 bath unit in Stonebrook — perfect for...
|





 The data relating to real estate on this website comes in part from the MLS® Reciprocity program of either the Greater Vancouver REALTORS® (GVR), the Fraser Valley Real Estate Board (FVREB) or the Chilliwack and District Real Estate Board (CADREB). Real estate listings held by participating real estate firms are marked with the MLS® logo and detailed information about the listing includes the name of the listing agent. This representation is based in whole or part on data generated by either the GVR, the FVREB or the CADREB which assumes no responsibility for its accuracy. The materials contained on this page may not be reproduced without the express written consent of either the GVR, the FVREB or the CADREB.